Maintenance and Downtime Tracking for AV Rental: How Your Gear Pays for Itself
Most AV rental houses don't know which pieces of gear are profitable. Maintenance and downtime tracking is how that changes.

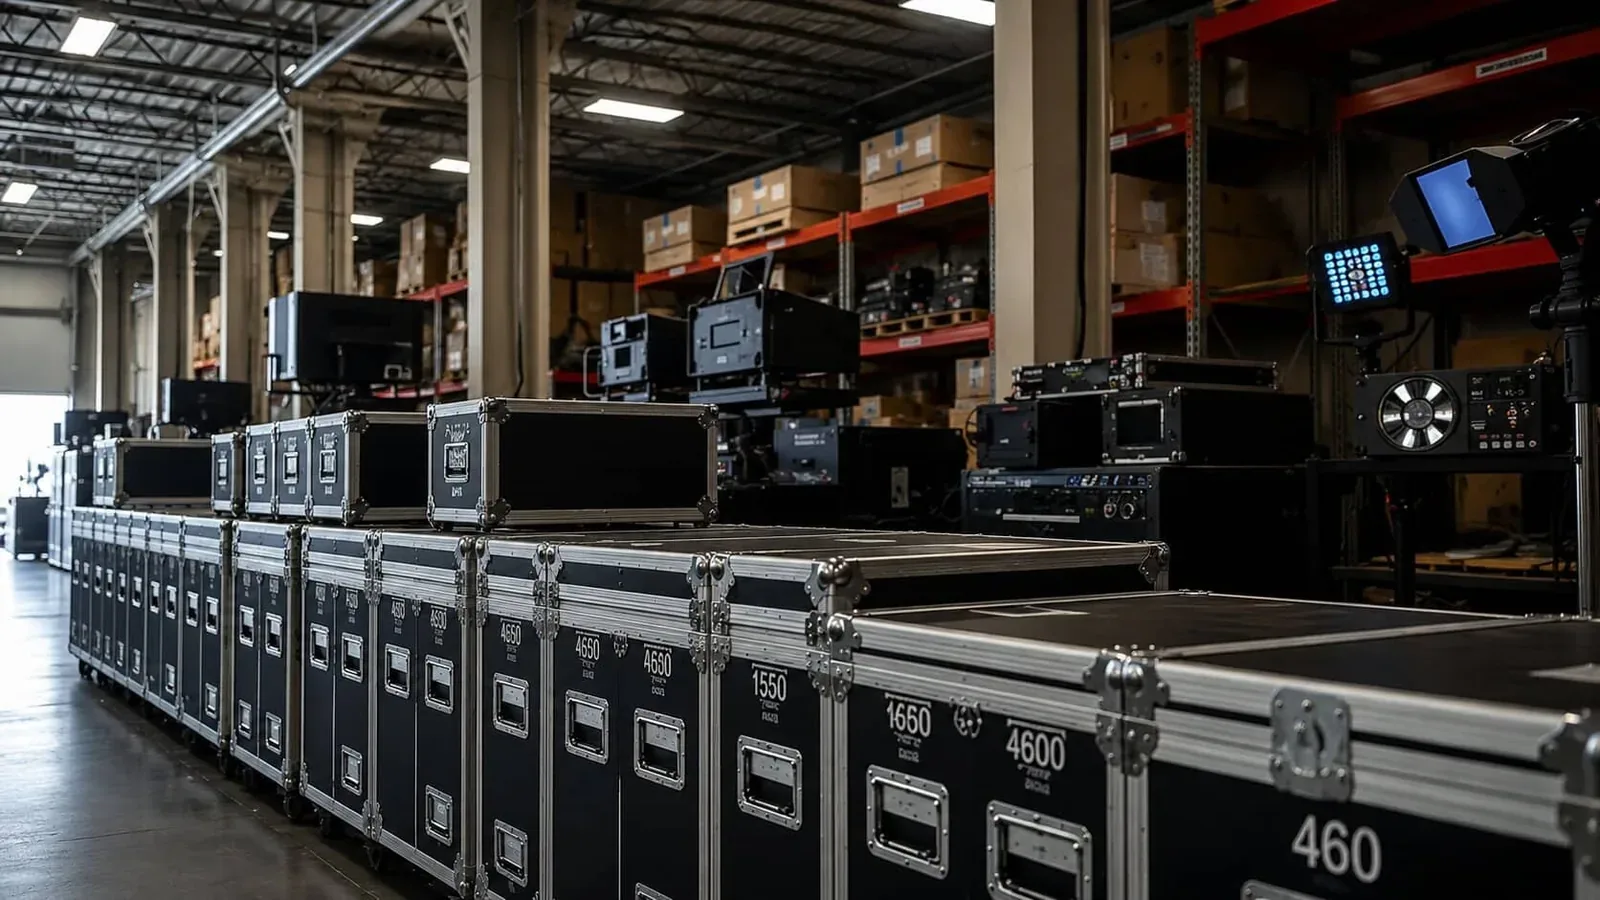
Ask the owner of an AV or event rental house which item in their warehouse has the highest return on investment, and you'll usually get a confident answer. Ask them how they know, and the confidence drops fast. Most operators are running on instinct, vendor reputations, and a vague memory of which items go out the most. The actual data, utilization, maintenance cost, downtime, is rarely tracked at the item level, and almost never tracked over time.
That's a problem, because rental gear is a depreciating asset that has to earn its keep. The console that books out twelve weekends a year and never breaks is not the same business as the console that books out twenty weekends but spends three of them in the shop. The invoice column is loud. The hidden costs, repairs, returns, replacement, lost gigs, are quiet. Without tracking, the loud number wins, and the actual profitability is invisible.
The three numbers that matter per item
There are exactly three numbers that tell you whether a piece of gear is paying for itself:
- Utilization, how many billable days per year is this item booked?
- Maintenance cost, what has been spent keeping it running, including parts, labor, and outside service?
- Downtime, how many days has it been unavailable when it should have been earning?
You don't need accounting precision on any of these. You need them tracked consistently for every item, every month, with totals that roll up by category. Within ninety days you'll start to see patterns. Within a year you'll know exactly which gear is worth re-investing in.
What downtime actually costs
Downtime is the most under-counted number. A console in the shop for two weeks during a slow stretch costs nothing. The same console in the shop during a busy weekend costs the rental fee plus the relationship with the client who had to be referred elsewhere plus the next rental that client would have booked. For a piece of gear, two weekends of downtime in the wrong month can erase a quarter of its annual revenue.
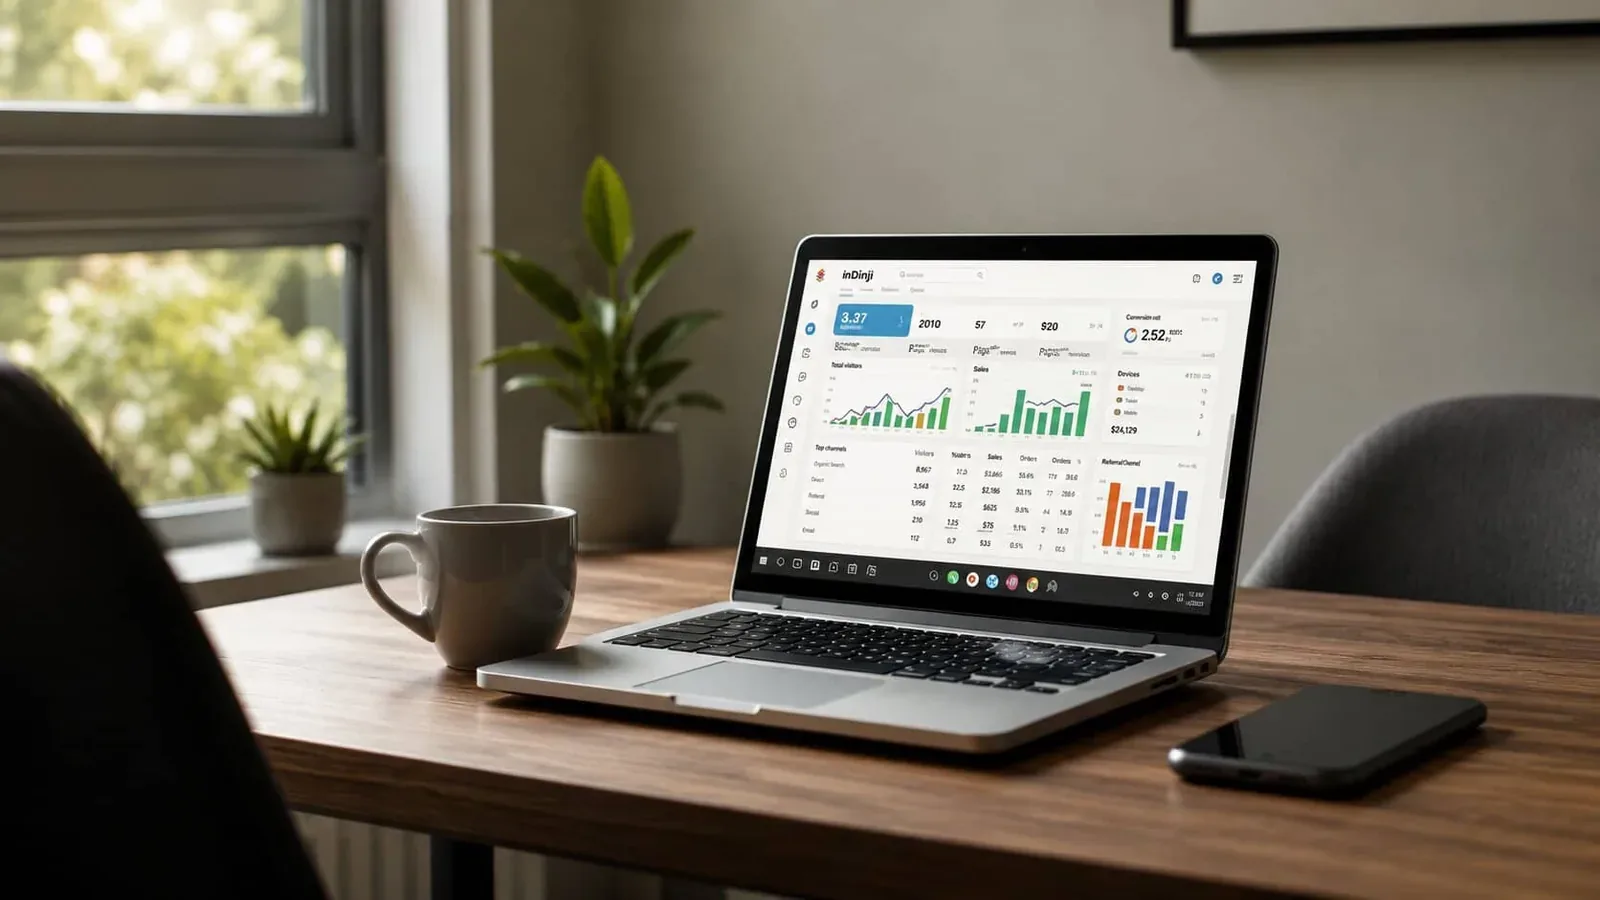
Tracking downtime alongside utilization makes this visible. A spreadsheet that shows downtime in red against the calendar of booked weekends turns a vague feeling, "that thing keeps breaking", into a concrete decision: replace, retire, or run it harder while the warranty is still good.
The flag that travels with the item
In practice, this only works if the maintenance flag lives on the item record, not in someone's head or on a clipboard. When a piece comes back with a problem, the technician notes it on the item itself, with photos. The item is moved to a maintenance status that prevents it from being included on the next pull. The repair is logged with date, parts, labor, and outside cost. When it's signed off, the maintenance event closes and the item goes back into rotation.
That history, accumulated over a year, is the data that makes capital decisions sane. You'll see the fixture that had four repairs in eighteen months and decide whether the model is the problem or that specific unit is the problem. You'll see the brand whose gear pays back twice as fast as another brand's. You'll see the expensive piece that booked twice and never since, and ask whether it's marketed correctly.
What changes for the team
Two things change when this system is running consistently. The warehouse team stops being the keepers of secret information about which gear is dodgy, anyone can see it. And the sales team stops over-promising on items that are likely to be in the shop, because the calendar shows actual availability rather than the wishful version.
The deeper change is cultural. Each piece of gear becomes a small business unit with its own P&L. Decisions about what to buy, what to retire, and what to invest in stop being seasonal feelings and start being conversations grounded in the same data the rest of the company runs on.
Where to start
You don't have to build this all at once. Start with the top thirty most expensive items in the warehouse. Get a maintenance log on each one. Tie it to your booking system so utilization is automatic. Ask the technicians to flag downtime as it happens rather than reconstructing it later.
In six months you'll have enough data to make at least one capital decision you couldn't have made before. In twelve months you'll have eliminated the worst-performing items from the lineup and doubled down on the best. And in three years you'll have a fleet that pays for itself on schedule, instead of a warehouse where the question of which gear is actually profitable remains a mystery.
Frequently asked questions
What metrics should I track per item in an AV rental fleet?
Three: utilization (billable days per year), maintenance cost (parts + labor + outside service), and downtime (days unavailable when the item should have been earning). Roll them up by category for capital decisions.
How do you calculate AV gear utilization?
Billable rental days divided by available days in the period. Tie it to your booking system so the number is automatic — manual tracking always under-counts.
What is the true cost of equipment downtime?
Downtime during a slow stretch costs nothing. Downtime during a busy weekend costs the rental fee plus the client relationship plus the next booking that client would have made. Track downtime against your calendar of booked weekends to see the real number.
What software tracks AV rental maintenance and downtime?
Item-level rental management platforms with per-item maintenance logs, status flags that exclude broken gear from pulls, and reporting that ties utilization, repair cost, and downtime back to each piece.
How often should rental gear go through preventive maintenance?
Manufacturer interval as a baseline, adjusted up for high-utilization items. Tracking utilization per item is what lets you do this without over- or under-servicing the fleet.
Should I track every cable and adapter or focus on big pieces?
Focus on the top 30 most expensive items first. The 80/20 of maintenance and downtime cost lives there. Cables and adapters belong in bulk quantity tracking, not individual records.