The Final-Mile KPIs Every White-Glove Operator Should Track
On-time rate alone hides the problems that matter most in white-glove. Here are the metrics that actually predict retention and margin.

White-glove delivery is a high-stakes, high-margin business, and the KPIs that work for parcel or LTL don't transfer well. On-time percentage, the metric the parcel world worships, is almost useless in white-glove, because a delivery that arrives in the window but damages a $12,000 cabinet is not a win.
If you run a final-mile white-glove operation, here are the metrics that actually correlate with retention, referrals, and gross margin. Track them weekly. Show them to the team.
1. Window adherence, not on-time rate
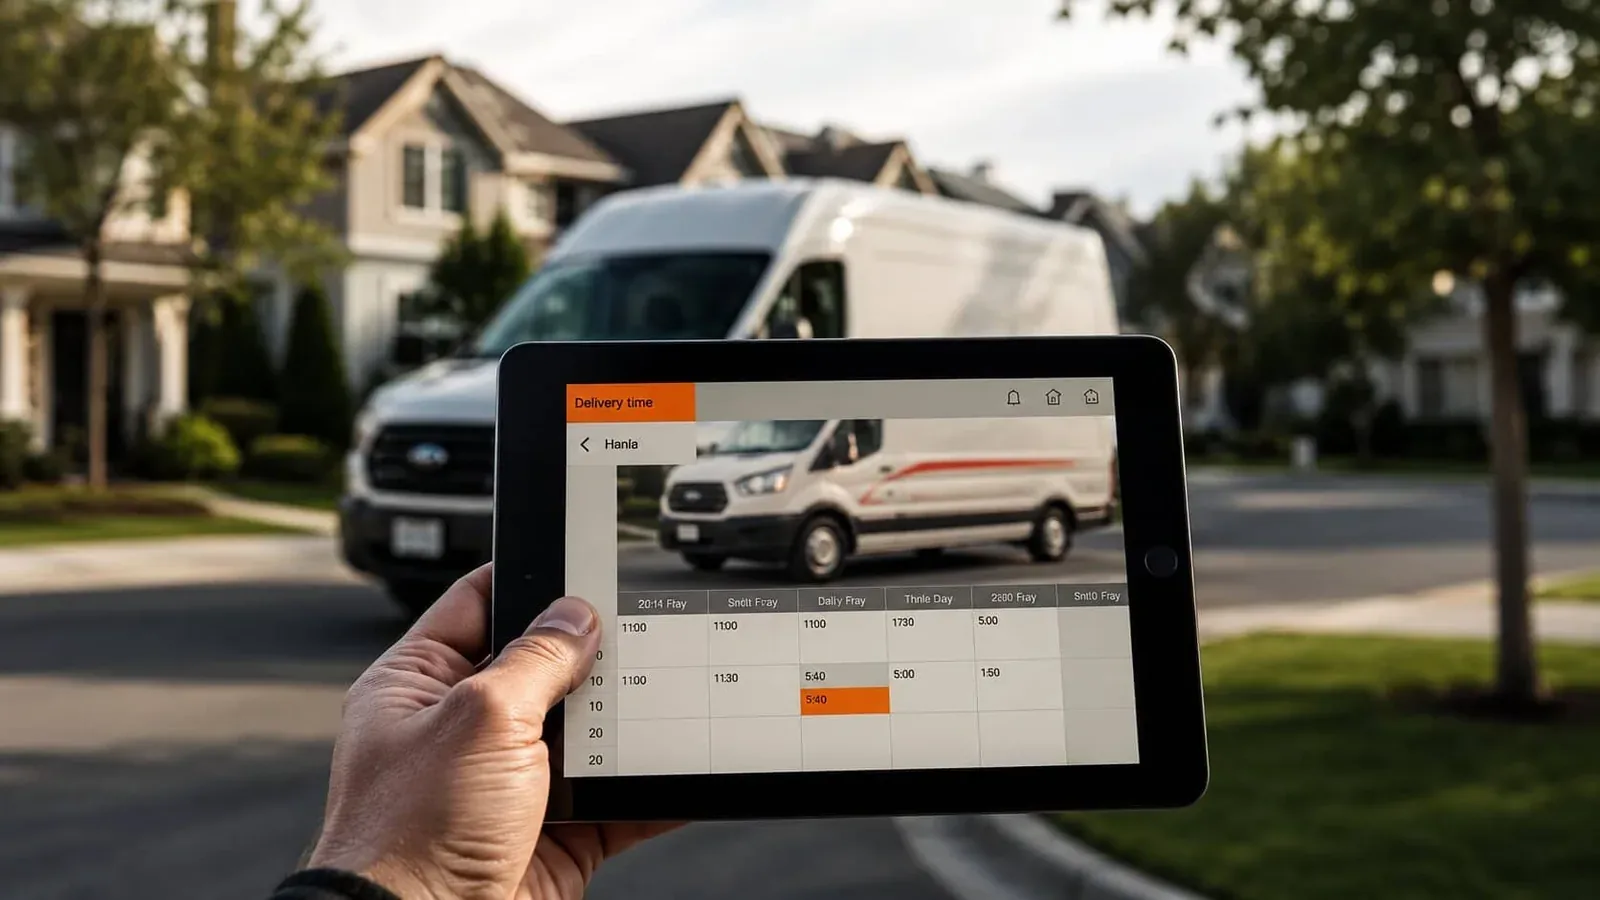
In white-glove, customers don't care if you arrived "by end of day." They care that you arrived in the two-hour window you promised. Window adherence is the percentage of jobs that started within the committed window, measured at the gate or the front door, not at "dispatched."
Anything below 90% is a customer-trust problem. Above 95% is competitive advantage. The gap between the two is usually scheduling discipline, not driving speed.
2. First-attempt success
This is the percentage of deliveries completed on the first visit without a return trip. A failed first attempt in white-glove is brutal: you eat the truck, the two-person crew, and the customer trust, and you still owe the delivery.
The leading causes are usually access issues (no elevator reservation, no certificate of insurance) and product issues (wrong item, damaged on the truck). Both are fixable with better pre-delivery checklists and tighter coordination with the property manager.
3. Damage-claim rate per 1,000 items
Not per delivery, per item. White-glove jobs vary wildly in item count, so per-delivery rates lie. Per-item rates tell you whether the crew handling and packing standards are holding.
If this number is creeping up, look at intake photos first. Damage that's "discovered" at delivery is often damage that happened before pickup but wasn't documented. The fix is a tighter intake workflow with mandatory six-side condition reports before anything leaves the warehouse.
4. Customer-signed proof-of-delivery completion
What percentage of jobs end with a digital signature, condition acknowledgement, and at least one delivered-state photo, all uploaded before the truck leaves the curb? It should be 100%. Anything less is open exposure for a future damage dispute you will lose because you have no record.
This is a process metric, not an opinion metric. If it's at 87%, you have a crew-training problem, not a software problem.
5. Hours per job, by job type
Track average crew-hours separately for in-home placement, simple drop-off, assembly, and packing. The number that matters is the trend, not the absolute. When it drifts up, costs are silently rising. When it drifts down without a complaint spike, you've found real productivity.
6. Revenue per stop
Total revenue divided by completed stops, week over week. This is the cleanest single number for whether the business is growing or just getting busier. Two stops at $400 each beats four stops at $150 most weeks, because the variable cost is in the stop, not the revenue.
7. Customer NPS or post-delivery rating
Send a single-question survey within four hours of completion. Don't wait until the next day. The post-delivery response rate triples when it lands while the experience is still fresh, and the comments are far more specific. Use the responses to calibrate which crews and which routes drive five-star results.
How to make the metrics actually move
Numbers on a dashboard don't change behavior. The shift happens when the metrics show up in the daily huddle, the weekly ops review, and the monthly compensation conversation. The right white-glove delivery software calculates these in the background and surfaces them where the team already works, the dispatch screen, the crew app, the manager portal, so nobody has to open a separate analytics tool to see how Tuesday went.
If you're tracking on-time rate as your headline KPI in 2026, you're optimizing for the wrong thing. Customers in this category remember the broken cabinet, the missed window, the second trip. Build your dashboard around the metrics that predict those events, and the business gets quietly better in the places customers actually notice.